WD Blue 3D Nand SATA SSD (1TB) & SanDisk Ultra 3D SSD (1TB) Review
Summary: The WD Blue 3D Nand SATA SSD (1TB) & SanDisk Ultra 3D SSD (1TB) provide some excellent value for all computer users, including decent speeds for TLC technology.
4.8
Excellent Value!
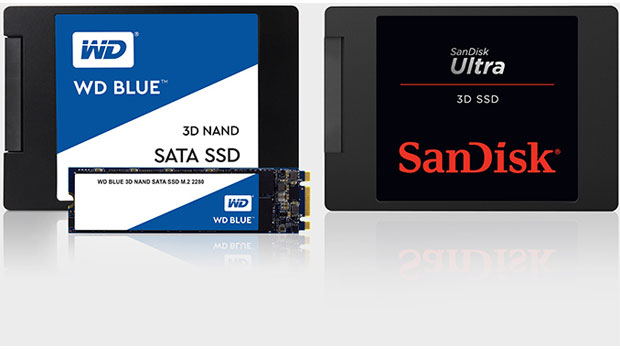
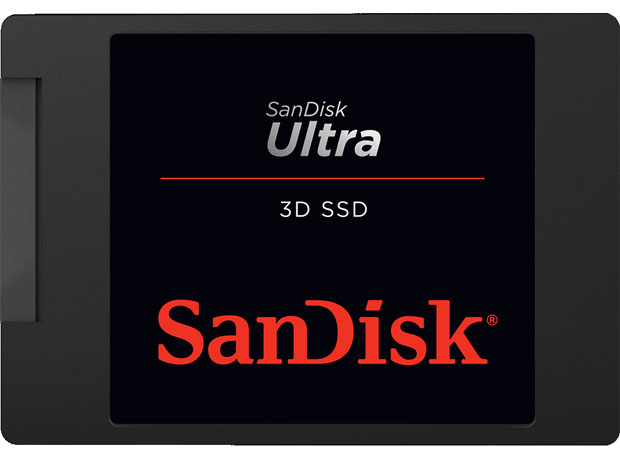
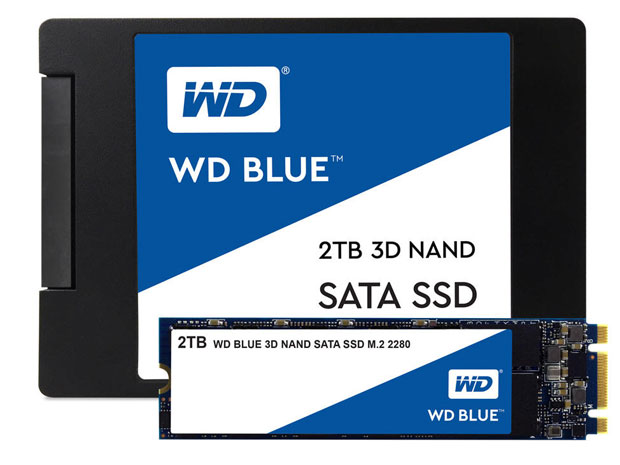
As you may be aware, SanDisk is now part of Western Digital and Impulse Gamer had the opportunity to review their latest 3D NAND based-technology Solid-State Drives (SSD), the WD Blue 3D NAND SATA SSD and the SanDisk Ultra 3D SSD with both review models boasting a capacity of up to 1TB. For consumers, each of these drives start from 250GB and go up to 2TB in size, ensuring that their is an SSD for everyone, no matter what your budget.
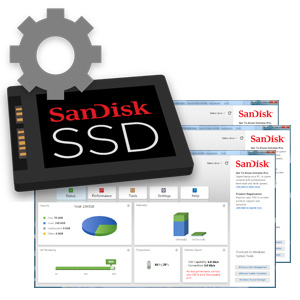
Furthermore, the WD Blue 3D and SanDisk Ultra 3D are almost identical when it comes to performance and use the TLC (Three Level Cell) flash technology which is cheaper to produce than MLC. Also, both SSD units have identical hardware and specifications plus they give the powerful Samsung 850 EVO a run for its money in terms of performance. The main differences between both drives is the packaging which is purely esthetics. Another highlight is the excellent SSD Dashboard which not only monitors the drives but allows for slight tweaking.
For internal specifications, each SSD uses the Marvell 88SS1074 Controller that supports four NAND channels with a SATA 6Gbps interface, including Micron DRAM cache and a 64-layer 3D BiCS flash memory. According to WD and SanDisk, the sequential read speed is 560MB/s with a write speed of 530MB/s and for some additional piece of mind, a 3-year warranty with a mean time to failure of 1.75 million hours. In other words, your drive will probably outlast your system by several years… maybe 50 or so!
WD Blue 3D Nand SATA SSD & SanDisk Ultra 3D SSD Specifications
| Capacity | 250 GB | 500 GB | 1 TB | 2 TB | |
| Form Factors: | WD Blue 3D NAND SATA SSDs: 2.5″ and M.2-2280 SanDisk Ultra 3D: 2.5″ |
||||
| Controller | Marvell | ||||
| NAND Flash | 64-layer 3D TLC NAND | ||||
| Sequential Read | 550 MB/s | 560 MB/s | |||
| Sequential Write | 525 MB/s | 530 MB/s | |||
| Random Read IOPS | 95K | ||||
| Random Write IOPS | 81K | 84K | |||
| Pseudo-SLC Caching | Supported | ||||
| DRAM Buffer | unknown | ||||
| Encryption | unknown | ||||
| Power Management | Slumber, Device Sleep, etc. | ||||
| Power Consumption | Max Read Operating | 2.2 W | 2.05 W | 2.55 W | 3 W |
| Max Write Operating | 2.25 W | 3.35 W | 3.75 W | 3.8 W | |
| Average Active Power | 52 mW | 60 mW | |||
| Warranty | 3 years | ||||
| MTBF | 1,750,000 hours | ||||
| TBW | 100 TB | 200 TB | 400 TB | 500 TB | |
Benchmarks
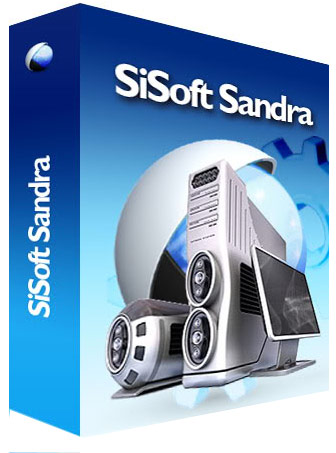
Our test machine included an Intel Core i7-7700K CPU with 16GB of Crucial DDR4-2666 RAM with Windows 10 Professional as the base operating system. Our first test was with SiSoftware SANDRA with their physical disk benchmark test.
SiSoftware SANDRA (WD Blue)
#: Average Speeds
- Read (MB/s) 527.3
- Write (MB/s) 435.9
SiSoftware SANDRA (SanDisk Ultra 3D)
#Average Speeds
- Read (MB/s) 527.28
- Write (MB/s) 434.4
Although some slight differences, you can see how the same components produce very similar results. Although a little on the lower side, both SSD’s are still in the midrange category. Following SiSoftware SANDRA, we used the popular and free CrystalDiskMark that tested the sequential reads of both SSD’s and it almost mirrored the speeds from WD and SanDisk.
CrystalDiskMark (WD Blue)
- Read (MB/s) 547.1
- Write (MB/s) 525.2
CrystalDiskMark (SanDisk Ultra 3D)
- Read (MB/s) 547.9
- Write (MB/s) 526.1
Another free benchmarking tool was ATTO Disk Benchmark that is used throughout the industry to test hard drives which offers users a plethora of tweaks. Like our other benchmarks, we use the ‘base’ settings to help with our tests.
ATTO Disk Benchmark (WD Blue)
- Read (MB/s) 562.8
- Write (MB/s) 534.1
ATTO Disk Benchmark (SanDisk Ultra 3D)
- Read (MB/s) 559.2
- Write (MB/s) 535.3
The tests used in ATTO Disk Benchmark really pushed the drive to its maximum and produced some very impressive read and write speeds. However in a real-world setting, these speeds can not be reached on a regular basis.
For a more holistic test, we used HD Tune Pro which provides a good snapshot of the drive and is more akin to something that the user would experience on a day to day basis.
HD Tune Pro (WD Blue)
- Read (MB/s) 396.2
- Write (MB/s) 359.3
HD Tune Pro (SanDisk Ultra 3D)
- Read (MB/s) 397.1
- Write (MB/s) 359.9
The last benchmarking app we used was FutureMark PCMark 7 which is ideal for comparing your hard drive to other configurations from around the world. Both drives scored a very respectable score and were slightly behind the Samsung EVO 850 which has been a long standing leader in the world of SSDs.
Secondary Storage Benchmark, Overall Score (WD Blue)
- Overall Score 5561
Secondary Storage Benchmark, Overall Score (SanDisk Ultra 3D)
- Overall Score 5559
Final Thoughts?
Although both SSD’s are not the fastest drives on the market, they do shine in terms of affordability with some relatively impressive read and write speeds. With an excellent 3-year warranty and two different type of form factors, WD will definitely find a market for both SSD’s and in our tests, we found the SanDisk Ultra 3D slightly faster, however when it comes to benchmarking, it is a very subjective algorithm, given the differences of processors, memory and motherboards. Needless to say, both drives performed exceptionally well, particularly from a price point which will definitely give the competition a run for their money!


