SanDisk Extreme SSD 1TB Review (SDSSDE61-1T00-G25)
SanDisk was acquired by Western Digital back in 2016, which has seen the SanDisk line up converging with Western Digital, in particular with the hard disks. For all intents and purposes, the SanDisk portable hard disks are in fact WD hard disks.
Comparatively, this review should also be read along with a recent review of the WD My Passport 1TB SSD as the internal hardware is the same.
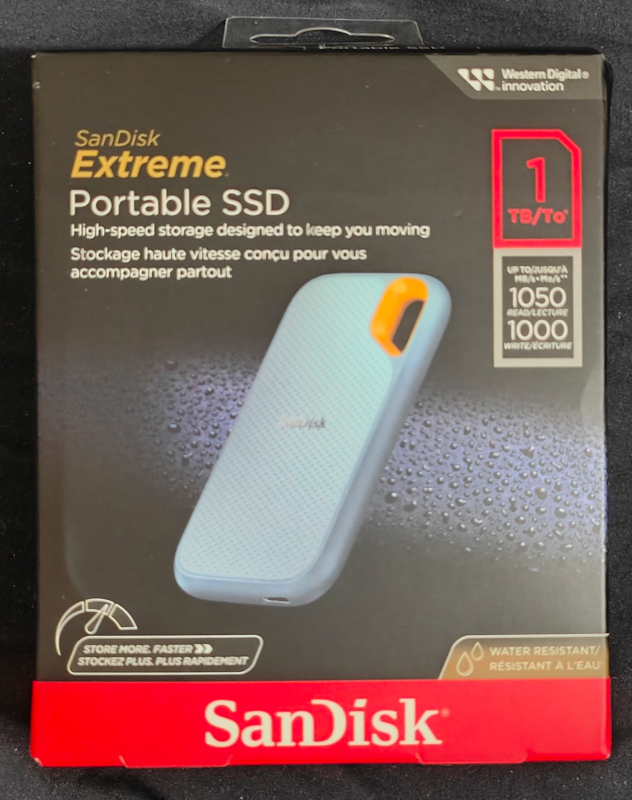
What is worth noting on the specifications below, is the “up to 550MB/s read speeds” is in conflict with the stated figures on the box of 1050MB/s.
Features
- Fast NVMe solid state performance in a portable, high-capacity drive
- Drop protection, IP65 water and dust resistance, X-ray and shock proofing
- Help keep private content private with the included hardware encryption
Specifications
- Capacity: 1TB
- Connector: USB-C
-
Compatibility: Compatible laptop or desktop
-
Sequential Read Performance: 1050MB/s
-
Sequential Write Performance: 1000MB/s
-
Interface: USB 3.2 Gen 2
- Warranty: 5-Year Limited Warranty
-
Durability:IP-65-rated for water- and dust-resistance
-
Dimensions (L x W x H):9.6mm x 52.55mm x 100.8mm
-
Weight: 52gms
-
Model Number:SDSSDE61-1T00-G25
-
Operating Temperature:0°C to 45°C
-
Non-Operating Temperature:-20°C to 85°C
-
Certifications:CE,FCC,RCM, BSMI, EAC, UKCA, ICES, BIS
Unboxing and First Impressions
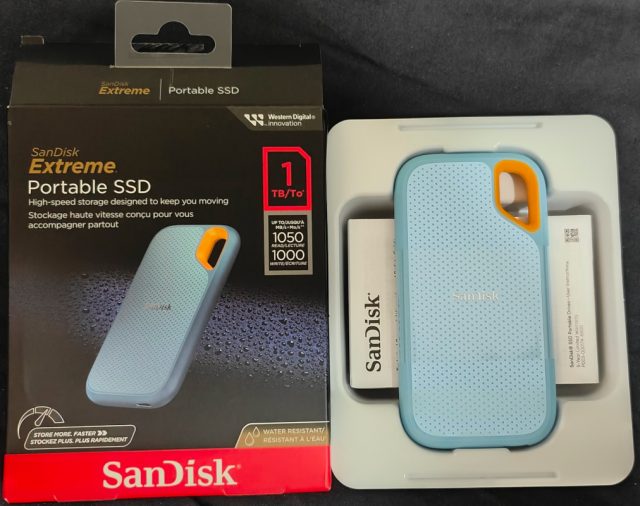
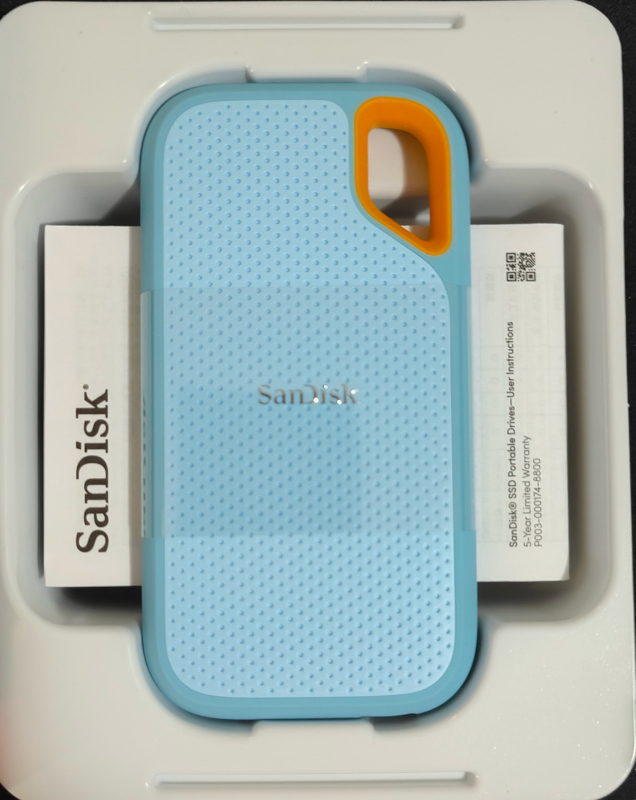
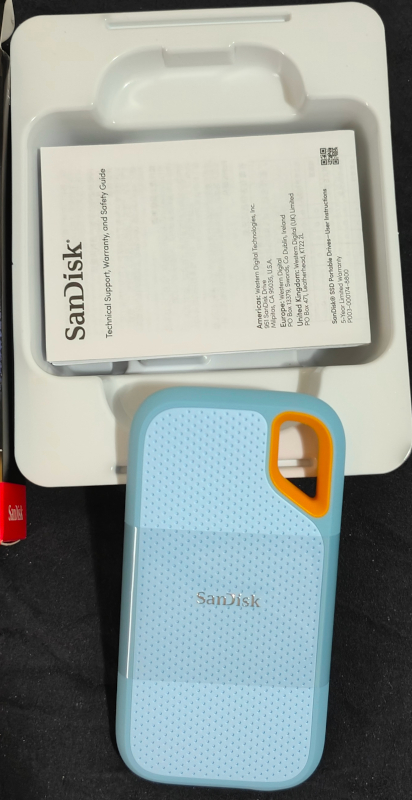
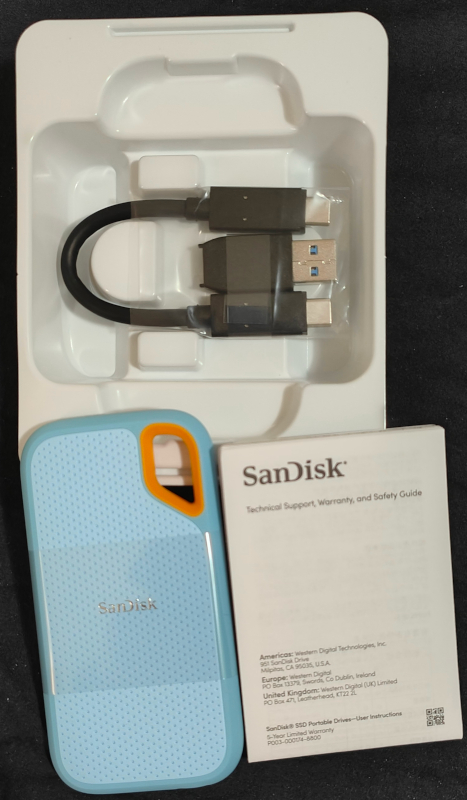
The box design and branding is for the most part, unchanged from previous SanDisk Extreme releases. This design, internal carrier and inclusions are 100% identical to the WD My Passport counterpart.
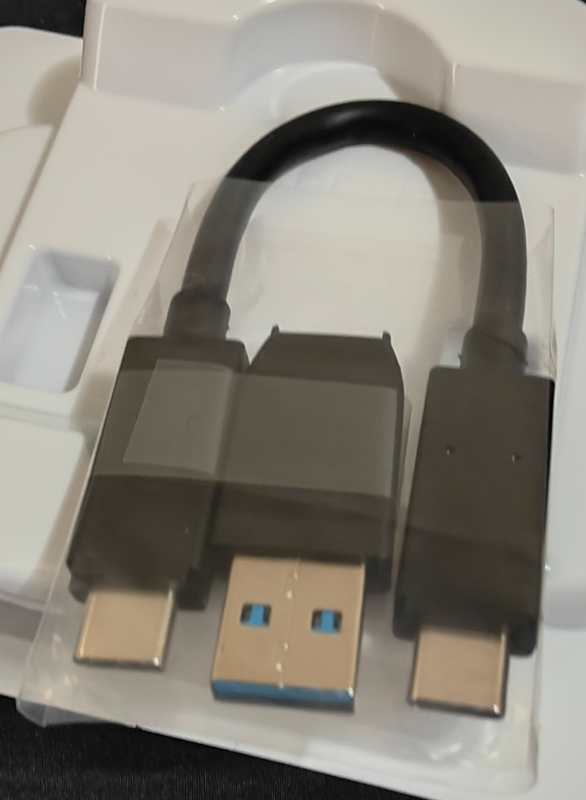
Included is the frustratingly short USB-C cable with the losable USB-A socket adaptor.
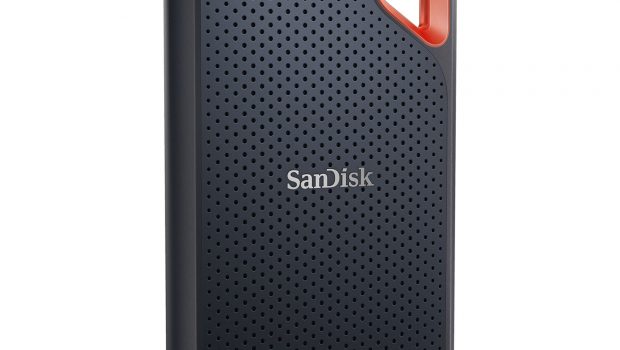
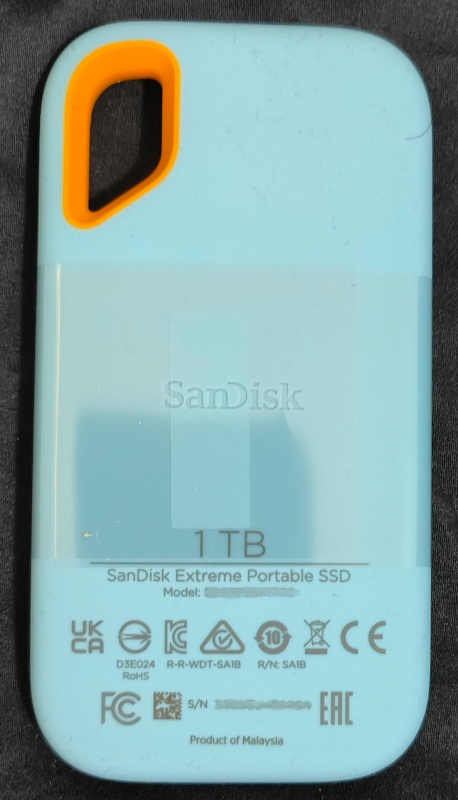
The case bezel is feels great in the hand, affords a lot of grip and is firm and solid. This is the kind of hard drive you could use and abuse and transport in bags, pockets, etc. The handy large islet is perfect for a carabiner or to loop cables through and this design is simply much more superior to the My Passport from a portability standpoint.
Performance Testing
The testing rig that Western Digital used to performance test, was “ASUS ROG STRIX Z270E GAMING ASSEMBLEED PC (Asmedia USB 3.1 Gen 2 controller), 1TB WD_Black SN750 NVMe™ SSD, Intel® Core™ i7-7700 CPU @ 4.20GHz, Windows® 10 Professional (64-bit)”
Although we didn’t have this exact rig, we did use a comparable testing rig with:
- AMD Ryzen 7 3800X 8-Core Processor
- ASUS ROG Crosshair VIII Formula
- WD Black 1TB (WDS100T3X0C-00SJG0) and WD Black 2TB (SN850X)
All tests were performed by USB-C directly connected to the motherboard with the supplied cable.
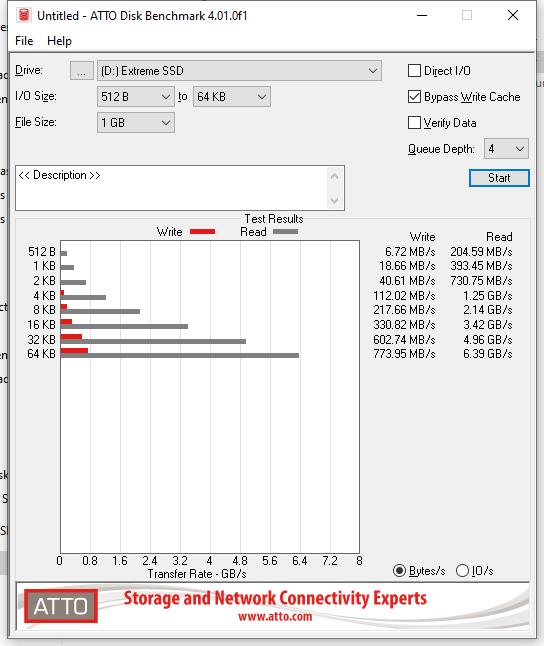
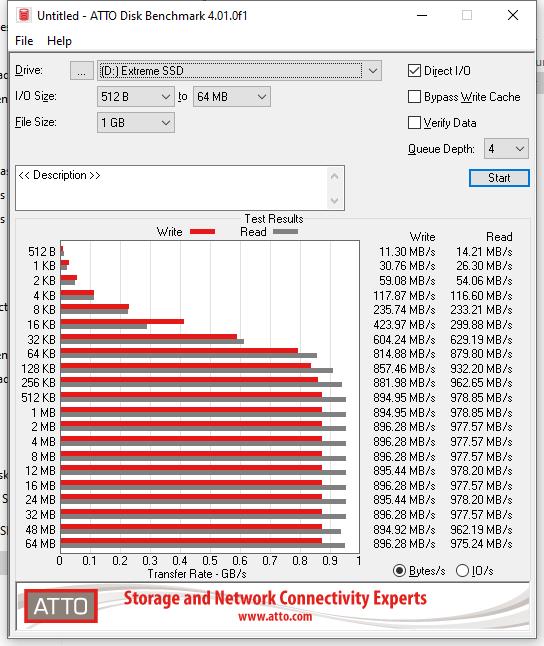
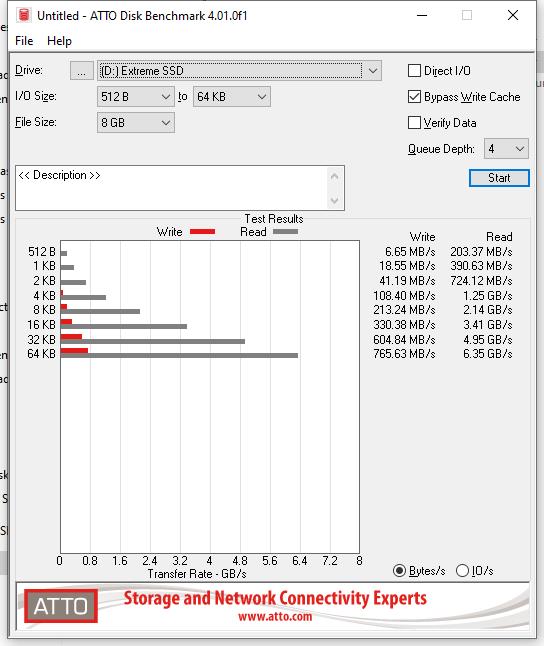
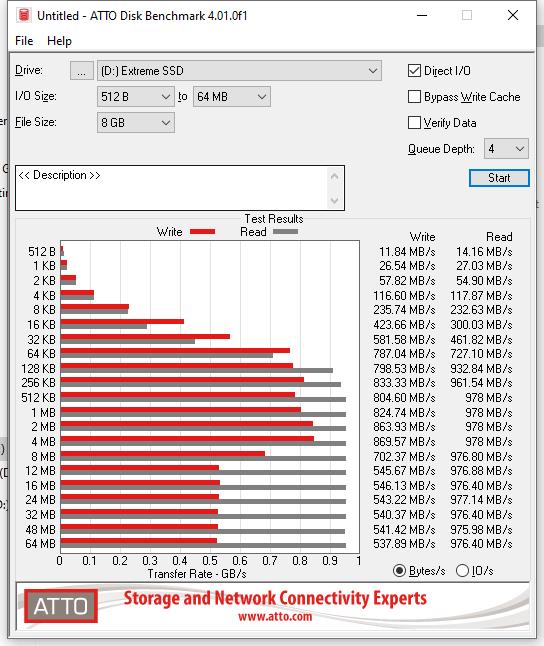
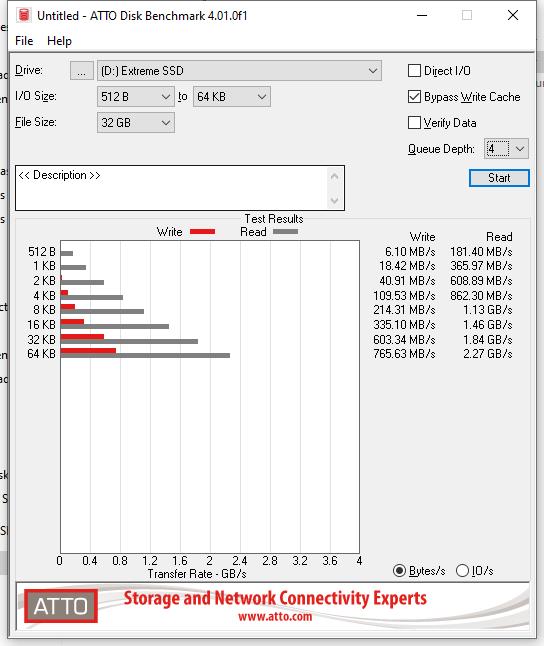
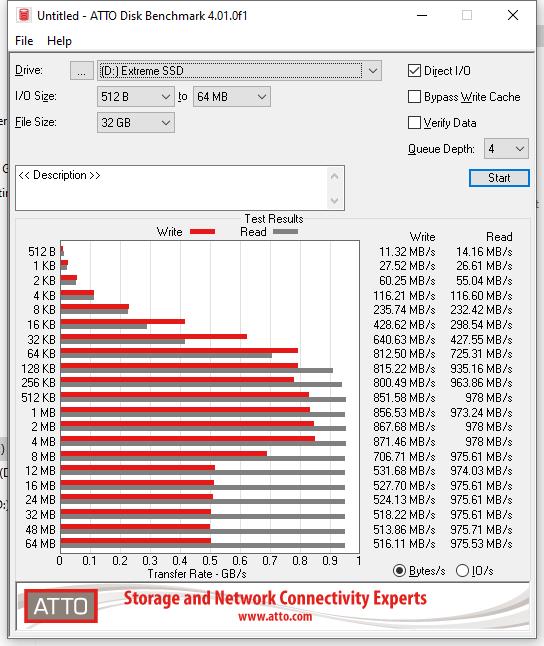
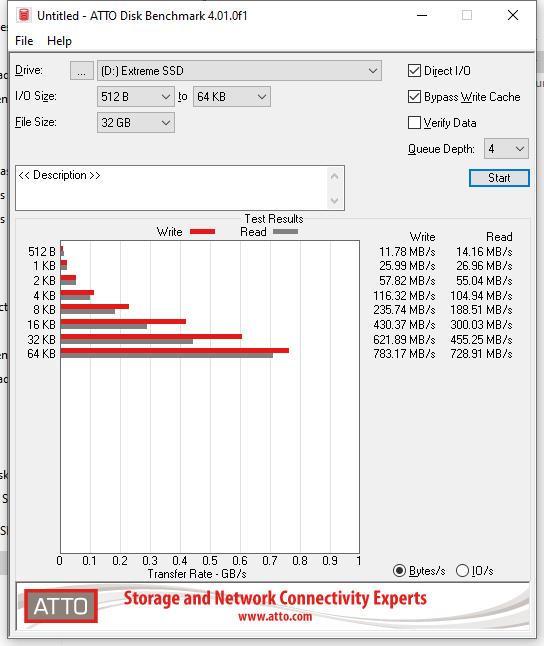
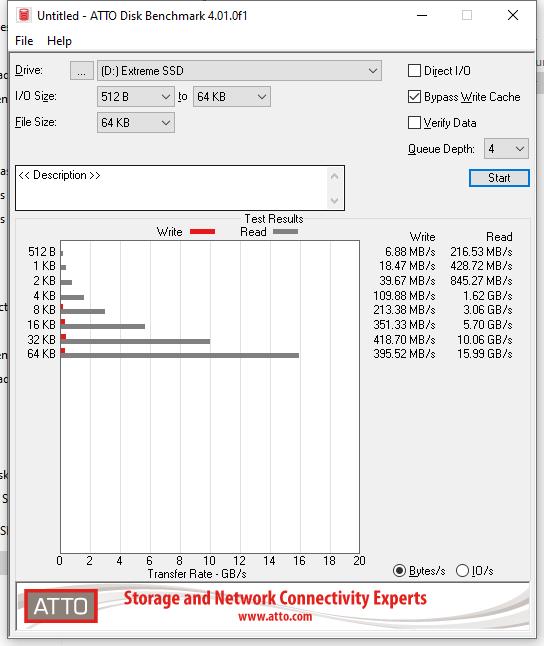
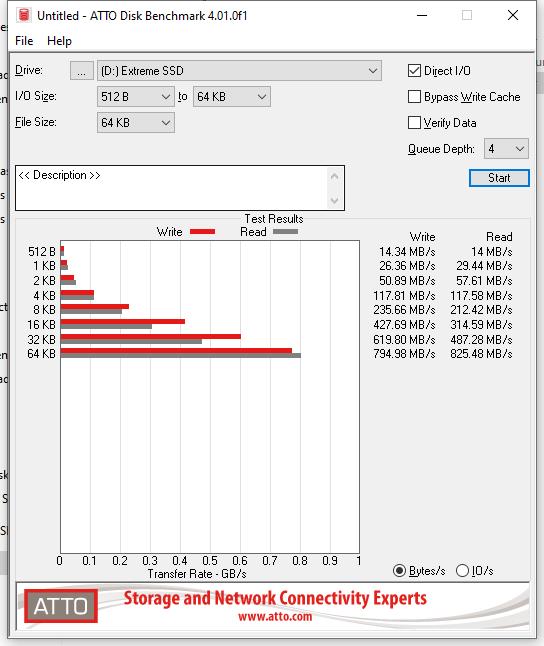
Testing was performed in Linux with KDiskMark and Windows 10 with ATTO. A series of tests were performed on both with exFAT, ext4 and NTFS formats, with read/write sizes of 16MiB to 64GiB and on each occasion, the read and write performance did not meet the advertised top speeds, and in fact did not even come close.
Linux – KdiskMark:
| KDiskMark (3.1.4): https://github.com/JonMagon/KDiskMark
Flexible I/O Tester (fio-3.1): https://github.com/axboe/fio ——————————————————————————– * MB/s = 1,000,000 bytes/s [SATA/600 = 600,000,000 bytes/s] * KB = 1000 bytes, KiB = 1024 bytes [Read] Sequential 1 MiB (Q= 8, T= 1): 585.142 MB/s [ 571.4 IOPS] < 12373.41 us> Sequential 128 KiB (Q= 32, T= 1): 585.142 MB/s [ 4571.4 IOPS] < 6548.16 us> Random 4 KiB (Q= 32, T=16): 134.702 MB/s [ 33676.6 IOPS] < 3754.87 us> Random 4 KiB (Q= 1, T= 1): 27.541 MB/s [ 6885.4 IOPS] < 144.48 us> [Write] Sequential 1 MiB (Q= 8, T= 1): 581.107 MB/s [ 567.5 IOPS] < 12941.24 us> Sequential 128 KiB (Q= 32, T= 1): 564.965 MB/s [ 4413.8 IOPS] < 6774.28 us> Random 4 KiB (Q= 32, T=16): 177.186 MB/s [ 44297.5 IOPS] < 3150.53 us> Random 4 KiB (Q= 1, T= 1): 47.968 MB/s [ 11992.1 IOPS] < 82.52 us> Profile: Default Test: 16 MiB (x5) [Measure: 5 sec / Interval: 5 sec] Date: 2024-02-18 16:33:28 OS: ubuntu-core 18 [linux 6.5.0-17-generic] |
| KDiskMark (3.1.4): https://github.com/JonMagon/KDiskMark
Flexible I/O Tester (fio-3.1): https://github.com/axboe/fio ——————————————————————————– * MB/s = 1,000,000 bytes/s [SATA/600 = 600,000,000 bytes/s] * KB = 1000 bytes, KiB = 1024 bytes [Read] Sequential 1 MiB (Q= 8, T= 1): 989.969 MB/s [ 966.8 IOPS] < 8246.94 us> Sequential 128 KiB (Q= 32, T= 1): 955.857 MB/s [ 7467.6 IOPS] < 4278.02 us> Random 4 KiB (Q= 32, T=16): 128.805 MB/s [ 32202.2 IOPS] < 3968.02 us> Random 4 KiB (Q= 1, T= 1): 25.793 MB/s [ 6448.4 IOPS] < 154.43 us> [Write] Sequential 1 MiB (Q= 8, T= 1): 911.330 MB/s [ 890.0 IOPS] < 8938.71 us> Sequential 128 KiB (Q= 32, T= 1): 881.315 MB/s [ 6885.3 IOPS] < 4638.63 us> Random 4 KiB (Q= 32, T=16): 117.724 MB/s [ 29432.1 IOPS] < 6649.41 us> Random 4 KiB (Q= 1, T= 1): 48.937 MB/s [ 12234.4 IOPS] < 80.89 us> Profile: Default Test: 1 GiB (x5) [Measure: 5 sec / Interval: 5 sec] Date: 2024-02-18 16:47:00 OS: ubuntu-core 18 [linux 6.5.0-17-generic] |
| Flexible I/O Tester (fio-3.1): https://github.com/axboe/fio
——————————————————————————– * MB/s = 1,000,000 bytes/s [SATA/600 = 600,000,000 bytes/s] * KB = 1000 bytes, KiB = 1024 bytes [Read] Sequential 1 MiB (Q= 8, T= 1): 1000.453 MB/s [ 977.0 IOPS] < 8181.12 us> Sequential 128 KiB (Q= 32, T= 1): 963.012 MB/s [ 7523.5 IOPS] < 4250.73 us> Random 4 KiB (Q= 32, T=16): 128.899 MB/s [ 32225.9 IOPS] < 3968.60 us> Random 4 KiB (Q= 1, T= 1): 22.887 MB/s [ 5721.8 IOPS] < 173.99 us> [Write] Sequential 1 MiB (Q= 8, T= 1): 855.142 MB/s [ 835.1 IOPS] < 9559.70 us> Sequential 128 KiB (Q= 32, T= 1): 841.735 MB/s [ 6576.1 IOPS] < 4863.19 us> Random 4 KiB (Q= 32, T=16): 114.288 MB/s [ 28573.0 IOPS] < 6591.32 us> Random 4 KiB (Q= 1, T= 1): 48.603 MB/s [ 12150.9 IOPS] < 81.43 us> Profile: Default Test: 4 GiB (x5) [Measure: 5 sec / Interval: 5 sec] Date: 2024-02-18 16:54:13 OS: ubuntu-core 18 [linux 6.5.0-17-generic] |
| KDiskMark (3.1.4): https://github.com/JonMagon/KDiskMark
Flexible I/O Tester (fio-3.1): https://github.com/axboe/fio ——————————————————————————– * MB/s = 1,000,000 bytes/s [SATA/600 = 600,000,000 bytes/s] * KB = 1000 bytes, KiB = 1024 bytes [Read] Sequential 1 MiB (Q= 8, T= 1): 996.845 MB/s [ 973.5 IOPS] < 8211.41 us> Sequential 128 KiB (Q= 32, T= 1): 963.163 MB/s [ 7524.7 IOPS] < 4249.93 us> Random 4 KiB (Q= 32, T=16): 130.408 MB/s [ 32602.9 IOPS] < 3919.97 us> Random 4 KiB (Q= 1, T= 1): 20.788 MB/s [ 5197.1 IOPS] < 191.64 us> [Write] Sequential 1 MiB (Q= 8, T= 1): 865.156 MB/s [ 844.9 IOPS] < 9434.80 us> Sequential 128 KiB (Q= 32, T= 1): 840.458 MB/s [ 6566.1 IOPS] < 4871.53 us> Random 4 KiB (Q= 32, T=16): 124.602 MB/s [ 31151.5 IOPS] < 4109.20 us> Random 4 KiB (Q= 1, T= 1): 50.055 MB/s [ 12513.9 IOPS] < 79.02 us> Profile: Default Test: 16 GiB (x5) [Measure: 5 sec / Interval: 5 sec] Date: 2024-02-18 17:10:23 OS: ubuntu-core 18 [linux 6.5.0-17-generic] |
| KDiskMark (3.1.4): https://github.com/JonMagon/KDiskMark
Flexible I/O Tester (fio-3.1): https://github.com/axboe/fio ——————————————————————————– * MB/s = 1,000,000 bytes/s [SATA/600 = 600,000,000 bytes/s] * KB = 1000 bytes, KiB = 1024 bytes [Read] Sequential 1 MiB (Q= 8, T= 1): 996.969 MB/s [ 973.6 IOPS] < 8210.42 us> Sequential 128 KiB (Q= 32, T= 1): 963.214 MB/s [ 7525.1 IOPS] < 4249.76 us> Random 4 KiB (Q= 32, T=16): 128.213 MB/s [ 32054.3 IOPS] < 3988.92 us> Random 4 KiB (Q= 1, T= 1): 18.940 MB/s [ 4735.1 IOPS] < 210.39 us> [Write] Sequential 1 MiB (Q= 8, T= 1): 866.476 MB/s [ 846.2 IOPS] < 9423.09 us> Sequential 128 KiB (Q= 32, T= 1): 839.151 MB/s [ 6555.9 IOPS] < 4878.85 us> Random 4 KiB (Q= 32, T=16): 124.821 MB/s [ 31206.2 IOPS] < 4101.25 us> Random 4 KiB (Q= 1, T= 1): 49.831 MB/s [ 12457.7 IOPS] < 79.34 us> Profile: Default Test: 64 GiB (x5) [Measure: 5 sec / Interval: 5 sec] Date: 2024-02-18 17:47:28 OS: ubuntu-core 18 [linux 6.5.0-17-generic] |
There was no significant difference in the partition type/format of the disk. We came close but never reached the top speeds and at the smaller file size, the write performance was very low.
Windows – ATTO:
There is a significant difference with the numbers when performing direct I/O and Bypass Write Cache tests. In any case, we were not able to reach a true 1000MB/s write or the 1050MB/s read performance. This disk did seem fairly more consistent between 128KB-64MB write tests, and this does bode well.
There performance of this disk is reasonable for standard use, in fact it is quite a solid performer, but these tests did not have encryption enabled and still underperformed the stated 1050MB/s with encryption. Had encryption been in place, we would have expected even further write performance drops.
Final Thoughts
As with the My Passport, this is a solid but safe entry from Western Digital’s SanDisk brand. But it is simply just a different bezel, in the same box carrier and marketed by brand-awareness to the public. And why not though! Although there are now only two samples tested, it would seem there is a high degree of commonality and the performance between batches would likely be on par with the results found here.
Although the performance of this disk was somewhat disappointing, the consistency performance of 900MB/s+ writes is far more favourable then burst writes of 1000MB/s sustained only for a few moments. Lest not forget the marketing team clearly states the magic get out of claim free clause of “up to..”.
Comparing the WD My Passport 1TB SSD to the SanDisk Extreme 1TB is only worthwhile strictly on an appearance and price point. should only come down to a consideration of price and warranty. Sure there were seemingly faster writes on the Extreme, but it is highly doubtful that the average performance of either of the two products would deviate more than 100-150MB/S from what was shown in the tests.
Summary: Great design, rugged and portable. The SanDisk Extreme delivers consistent transfer speeds in the portable storage market. Worth a look.


